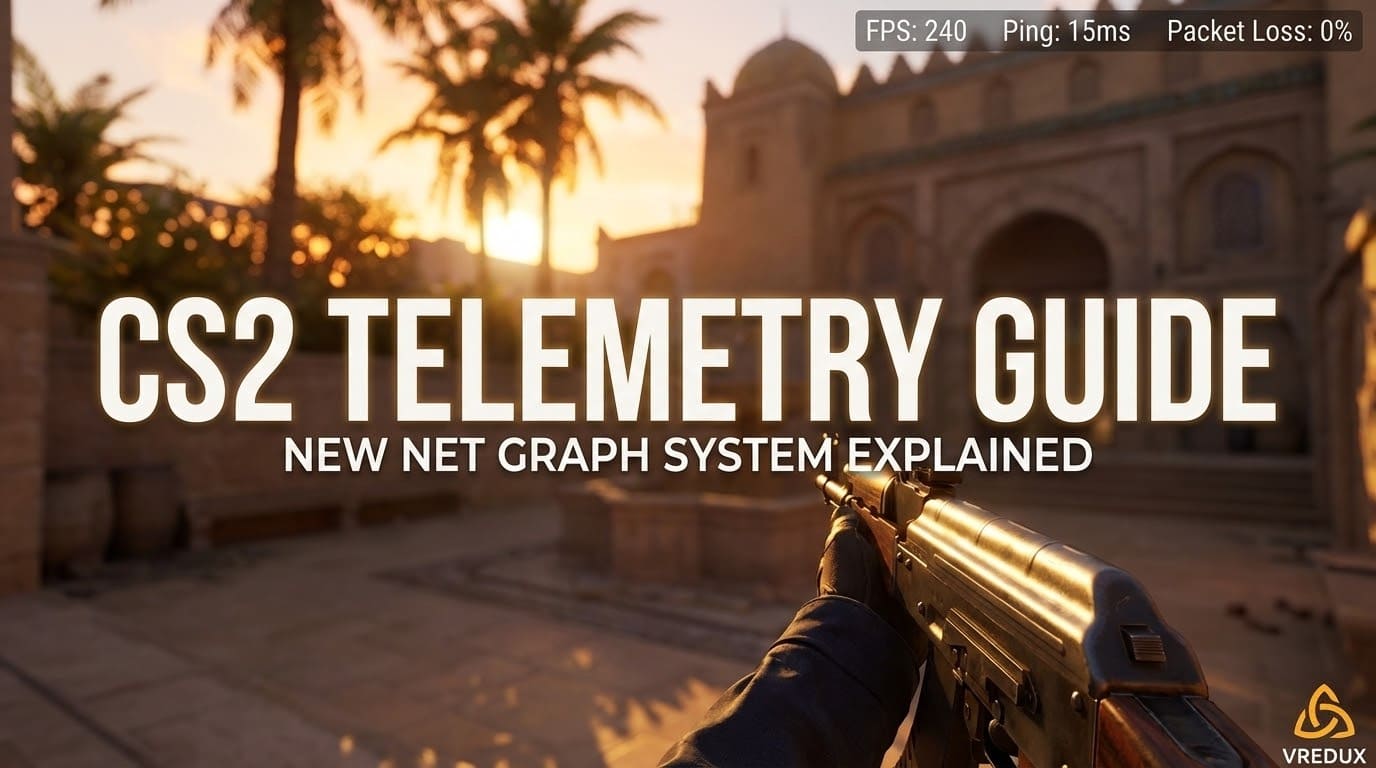
Let’s be honest: the first thing 90% of us did when launching Counter-Strike 2 for the first time was open the developer console and type net_graph 1. And what happened? Absolutely nothing.
.jpg)
For veterans of Counter-Strike: Global Offensive, this was a bit of a shock. We were used to having that trusty block of text showing our FPS, ping, and tick rate right on the screen. It was our lifeline to understanding performance in CS2.
But here is the good news: Valve didn't remove this feature; they evolved it. The old net_graph has been replaced by a new, cleaner system called Telemetry.
Article Contents:
In this guide, we will break down exactly how to see net graph in CS2, which console commands you need, and how to configure the new telemetry system to monitor your network stats and frames per second like a pro.
Where is the Net Graph in CS2?
If you are looking for the classic net_graph 1 command, I have bad news: the console command doesn’t work anymore. Valve Corporation decided to retire the bulky text block that used to cover the bottom of our screens.
Instead, Counter-Strike 2 uses a modern, integrated HUD element. This new system allows you to monitor FPS, packet loss, and latency without needing to type complex codes every time you launch the game.
Why the change?
- Cleaner UI: The new overlay takes up less screen space.
- Smart Display: You can set it to only appear when network issues or frame time spikes occur.
- Customization: You can control ping and FPS visibility separately.
.jpg)
How to Enable Net Graph in CS2 (The Easy Way)
You don't necessarily need to be a coder to get your stats back. The easiest way to enable and view the net stats is through the game settings.
Here is the step-by-step guide:
- Open the Settings Menu (gear icon).
- Go to the Game tab.
- Scroll down to the Telemetry section.
- Here you will see options for:
- Show Frame Time and FPS
- Show Ping
- Show Packet Loss / Misdelivery
For each metric, you have three choices:
- Never: The stat is hidden.
- If conditions are poor: Only shows if you have high ping or low FPS.
- Always: The counter stays on screen (closest to the old net_graph).
My recommendation? Set “Show Frame Time and FPS” and “Show Ping” to Always. Knowing your real-time stats helps you distinguish between your PC lagging and the game server acting up.
.jpg)
CS2 Net Graph Console Commands: The Pro Method
If you are like me, you prefer using the developer console because it’s faster and makes you feel like a hacker. While the specific net_graph command is gone, there are new CS2 telemetry commands that do the same job.
To use these, you first need to open the console (usually the ~ key). If it doesn't open, ensure "Enable Developer Console" is checked in settings.
1. The Main Telemetry Commands
These commands essentially toggle the settings we discussed above.
cl_hud_telemetry_frametime_show 2— Show frame time and FPS (2 = Always, 1 = Poor conditions, 0 = Never).cl_hud_telemetry_ping_show 2— Show ping and latency.cl_hud_telemetry_net_misdelivery_show 2— Show packet loss.
2. The Classic FPS Counter
If you just want a simple number without the fancy bars, the old cl_showfps still exists, but with new variations.
cl_showfps 1— Shows a simple FPS counter in the corner of your screen.cl_showfps 2— Shows FPS, Frame Time, and Min/Max data (more detailed).cl_showfps 3— Displays server tick rate and thread performance.cl_showfps 0— Turns it off.
Note: cl_showfps draws the text over the HUD, which can sometimes look messy compared to the native telemetry system.
3. The "Real" Net Graph Replacement: cq_netgraph
There is one command that actually adds a visual graph: cq_netgraph 1.
However, don't get your hopes up too high. Unlike the detailed text of CS:GO, this command displays a waveform in the top right corner.
- Blue/Green blocks: Good connection.
- Red/Yellow blocks: Packet loss or jitter.
It’s less informative for reading exact numbers, but great for visualizing connection quality over time.
.jpg)
Understanding the Numbers: FPS, Ping, and Frame Time
Seeing the numbers is one thing; understanding them is another. To maintain optimal performance, you need to know what you are looking at.
Frame Time vs. FPS
We are all obsessed with Frames Per Second. But Frame Time is arguably more important for smoother gameplay.
- FPS: How many images your GPU pushes per second.
- Frame Time: The time (in ms) it takes to render one single frame.
If you have 300 FPS but your Frame Time is jumping all over the place, the game will feel stuttery. This is called "bad pacing." Monitoring frame time helps you spot these micro-stutters.
Ping and Packet Loss
- Ping (Latency): The time it takes for your data to reach the Valve server and come back. Ideally, you want this under 40ms.
- Packet Loss: Shown as a percentage of data. If this is anything above 0%, your shots might not register. This is often an ISP issue or Wi-Fi interference.
Comparison: Old Net Graph vs. New Telemetry
To help you adjust, here is a quick breakdown of how things have changed from Counter-Strike: Global Offensive to CS2.
| Feature | CS:GO (Old) | CS2 (New) |
|---|---|---|
| Command | net_graph 1 | cl_hud_telemetry_* |
| Position | Bottom Center (Customizable) | Top Right (Fixed) |
| Visuals | Text block + Graph lines | Clean numbers + optional bars |
| FPS Counter | Included in graph | Separate or Integrated |
| Customization | Size, font, position | Only visibility logic |
| Impact | Small FPS drop on potato PCs | Negligible / Optimized |
Honestly, while I miss the nostalgia, the CS2 net graph (Telemetry) is objectively better for visibility. It doesn't clutter the screen during competitive play.
.jpg)
Troubleshooting: Why Can't I See Net Graph in CS2?
Sometimes, even after entering the commands to activate, nothing shows up. Here are common fixes:
- Check HUD Scale: If your hud_scaling is too low or high, the telemetry might be pushed off-screen.
- Verify Game Files: Sometimes a corrupt config file breaks the UI.
- Remove Launch Options: Old commands like -tickrate or -freq in your Steam launch options might conflict.
- The "Poor Conditions" Trap: If you selected "When poor conditions," the HUD will disappear when your game is running well. Switch it to "Always" if you want to monitor these metrics constantly.
Ready to optimize your game further? I recommend checking out our guide on CS2 Console Commands for FPS to boost your frames, or learn How to Fix High Ping in CS2 if those telemetry numbers are looking red.
FAQ
How to make net graph smaller in CS2?
You cannot change the size of just the net graph independently yet. However, changing the global HUD scale (hud_scaling 0.95) will resize the telemetry info along with everything else.
What is the command to show ping in CS2?
The specific console command is cl_hud_telemetry_ping_show 2. This forces the ping indicator to stay on screen permanently.
Does enabling net graph lower FPS?
In CS2, the impact is virtually zero. The new telemetry system is part of the game's core UI, unlike the old debug tool. You can keep it on without fear of performance loss.
How do I interpret the red blocks in cq_netgraph?
If you see red blocks in the top right while using cq_netgraph 1, it means you are experiencing packet loss. This causes rubber-banding and unregistered shots. Check your internet connection immediately.
Is there a net_graph 1 alternative for CS2?
Yes, the closest alternative is setting all Telemetry settings to "Always" in the game menu. This gives you FPS, Ping, and Packet Loss data similar to the old graph.
Conclusion
The era of typing net_graph 1 every match is over, but performance monitoring in Counter-Strike 2 has evolved. By using the new telemetry settings or simple console commands, you can keep a close eye on your game’s performance without cluttering your view.
Whether you are a competitive player diagnosing a stutter or just want to brag about your higher FPS to friends, CS2 telemetry gives you the performance insights you need.
For more CS2 guides and tools to dominate the server, visit our main page at VRedux. Good luck, and may your ping be low!

